Introduction
Most of us do our analysis in Excel, then move the results into PowerPoint to present them. This workflow is common, but it can also take unnecessary time, especially when you need to copy charts, arrange slides, and write short insights for each result.
AI tools can help with this process, but there is one major concern: privacy. Many Excel reports contain sensitive business or organizational data that should not be uploaded to cloud AI tools.
This post continues the same local AI idea I explored in my previous post, Build a Private AI Data Analyst with PandasAI and Ollama, where I showed how data analysis can be done locally without sending data to cloud AI tools.
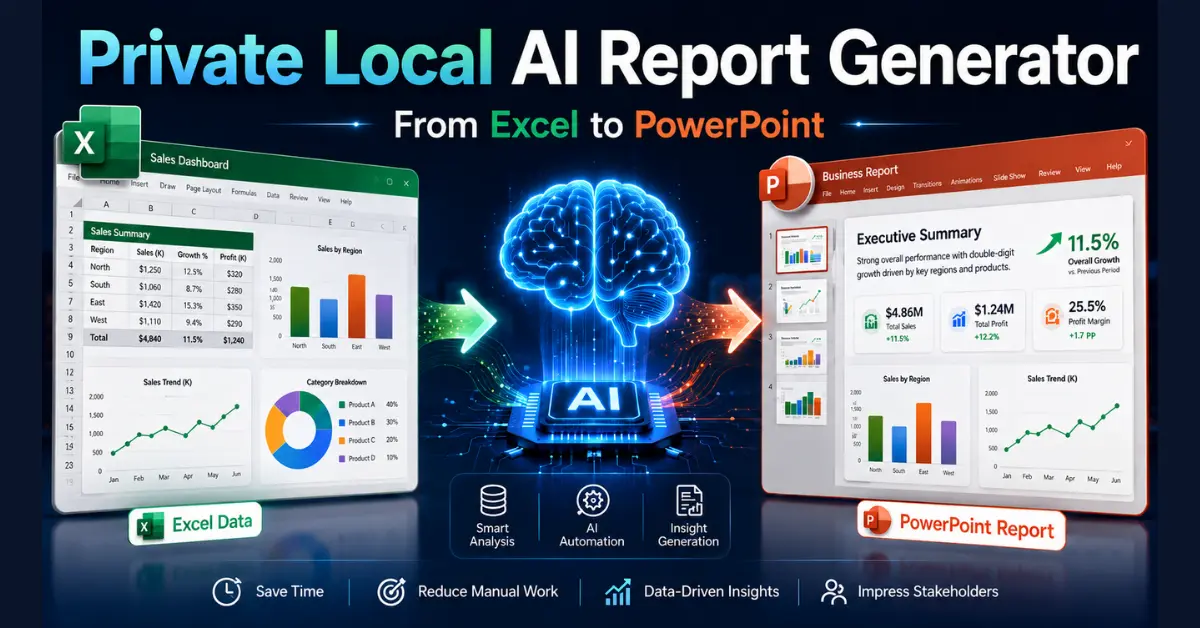
In this post, we will build a Private AI PowerPoint Report Generator from Excel with Ollama that turns Excel charts into PowerPoint slides with local AI-generated insights, while keeping your data on your own machine.
Step-by-Step Plan to Build the AI Report Generator
To create your private AI Report Generator, we will follow these main steps:
- Install Ollama – run local AI models on your computer.
- Pull a Local AI Model – download the model used for generating insights.
- Install Python Libraries – install the packages needed to build the app.
- Prepare an Excel File with Charts – use a workbook that already contains charts.
- Build the Streamlit App – create the interface for uploading and selecting charts.
- Generate AI Insights – send chart data to the local AI model.
- Create the AI Report Generator Output – add charts and insights into PowerPoint slides.
- Download and Review the Report – save and check the final PowerPoint file.
In the next sections, we will go through each step in detail and build the full workflow from setup to final PowerPoint report.
Step 1: Install Ollama
The first step in building our Private AI Report Generator is to install Ollama.
Ollama is the local AI engine that allows us to run language models directly on our own computer instead of sending data to a cloud AI service. This is important because our Excel charts may contain business or organizational data that should stay private.
Ollama works on Windows, macOS, and Linux, but in this guide, we will focus on the Windows setup.
To install Ollama:
- Go to the official Ollama website.
- Download the Windows installer.
- Run the setup file and follow the default installation steps.
- Once the installation is complete, Ollama starts running automatically in the background.
To confirm that Ollama is installed correctly, open PowerShell and type:
ollama --versionIf the version number appears, everything is set up correctly and ready for the next step.
Step 2: Pull a Local AI Model
After installing Ollama, the next step is to pull a local AI model. This model will be used by our AI Report Generator to read the extracted Excel chart data and generate short business insights for the PowerPoint slides.
In a previous post, I explained how to choose the right Ollama model based on your computer specs, especially RAM, GPU memory, and model size. In short, smaller models are faster and easier to run, while larger models usually provide better reasoning but need stronger hardware.
For this project, we will use Llama 3.1 8B because it gives a good balance between performance, reasoning quality, and local hardware requirements.
To download the model, open PowerShell and run:
ollama pull llama3.1:8bThis command downloads the Llama 3.1 8B model to your computer. Ollama handles the download and setup automatically, so you do not need to configure the model manually.
At this point, your computer has a working local AI model that can be used by the AI Report Generator without sending your Excel data to a cloud AI service.
Step 3: Install the Required Python Libraries
Before building the AI Report Generator, we need to install the Python libraries that allow the app to create the interface, communicate with Ollama, and control Excel and PowerPoint.
The full code for this AI Report Generator is available on GitHub, so you can download the project files and follow along with the setup.
Open PowerShell inside your project folder and run:
pip install streamlit requests pywin32These libraries are used for the following:
streamlit → creates the web interface for the tool
requests → sends prompts to the local Ollama model
pywin32 → controls Excel and PowerPoint from Python
The most important library here is pywin32, because this project uses Microsoft Office automation. This means the tool works locally on a Windows machine with Excel and PowerPoint installed.
Step 4: Prepare an Excel File with Charts
The next step is to prepare the Excel file that will be used by the AI Report Generator.
This tool works with Excel files that already contain charts. The app will scan the workbook, detect the available charts, extract their data, and then use them to create PowerPoint slides with AI-generated insights.
Before using the app, make sure your Excel file includes:
At least one chart
Clear chart titles
Readable chart data
Saved file format: .xlsx or .xlsm
For better results, use meaningful chart titles because the tool uses the chart title when generating the PowerPoint slide and the AI insight. For example, instead of a chart title like “Chart 1” use something clearer like “Monthly Sales Trend”, This helps the AI Report Generator create more useful and professional slide insights.
Step 5: Build the Streamlit App
Now we can build the Streamlit interface for the AI Report Generator.
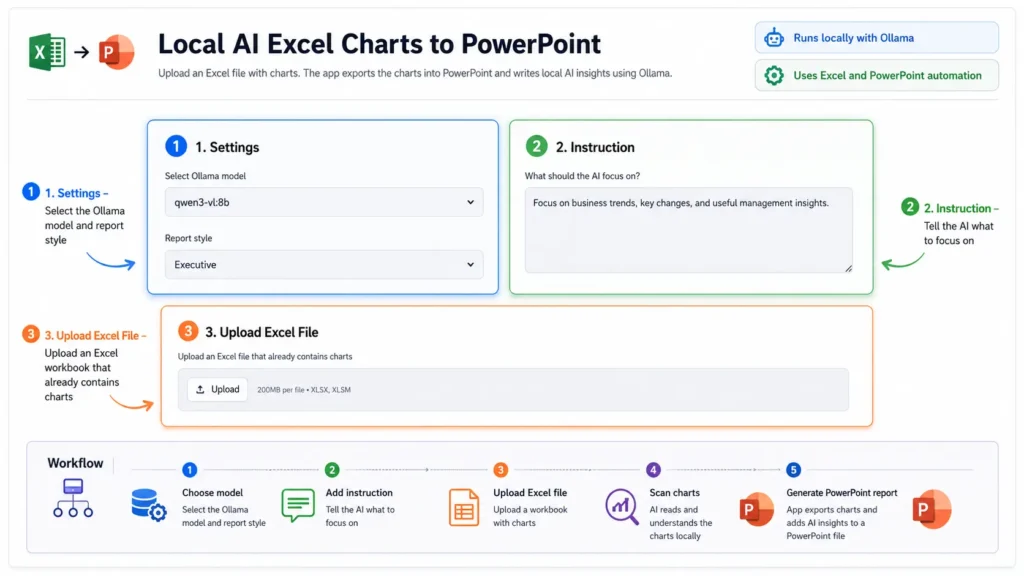
Streamlit allows us to create a simple local web app where the user can upload an Excel file, choose the local AI model, select the report style, and generate the PowerPoint report.
The main Streamlit setup starts with:
import streamlit as st

st.set_page_config(
    page_title="Local AI Excel Charts to PowerPoint",
    page_icon="📊",
    layout="wide"
)
Then we create the main page title and description:
st.markdown('<div class="main-title">Local AI Excel Charts to PowerPoint</div>', unsafe_allow_html=True)

st.markdown(
    '<div class="sub-text">Upload an Excel file with charts. The app exports the charts into PowerPoint and writes local AI insights using Ollama.</div>',
    unsafe_allow_html=True
)
The app also provides controls for selecting the model and report style:
selected_model = st.selectbox(
    "Select Ollama model",
    available_models,
    index=0
)

report_style = st.selectbox(
    "Report style",
    ["Executive", "Simple", "Technical", "Detailed"],
    index=0
)
Finally, the user uploads the Excel file:
uploaded_file = st.file_uploader(
    "Upload an Excel file that already contains charts",
    type=["xlsx", "xlsm"]
)
At this point, the AI Report Generator has a working interface where the user can provide the Excel file and choose how the report should be generated.
The full Streamlit app code is available on GitHub, including the complete interface, chart selection logic, and report generation workflow.
Step 6: Generate AI Insights
After uploading the Excel file and selecting the charts, the next step is to generate AI insights.
The AI Report Generator reads the chart title and chart data from Excel, then sends this information to the local Ollama model. The model returns a short business insight that will be added to the PowerPoint slide.
The function below creates the prompt that will be sent to the local AI model:
def get_ai_insight(chart_title, chart_data, model_name, user_instruction, report_style):
    prompt = f"""
You are writing a short business insight for a PowerPoint slide.

Report style:
{report_style}

User instruction:
{user_instruction}

Chart title:
{chart_title}

Chart data:
{chart_data}

Rules:
- Write one clear business insight only.
- Maximum 25 words.
- Do not use bullet points.
- Be accurate with the data.
- Do not explain your reasoning.
"""

    return call_ollama(model_name, prompt)
This prompt gives the model the chart title, the extracted chart data, the selected report style, and the user instruction. It also limits the response to one short insight, so the PowerPoint slide stays clean and professional.
The app sends the prompt to Ollama using a local request:
def call_ollama(model_name, prompt):
    try:
        response = requests.post(
            f"{OLLAMA_URL}/api/generate",
            json={
                "model": model_name,
                "prompt": prompt,
                "stream": False
            },
            timeout=180
        )

        result = response.json()

        if "response" not in result:
            return f"AI response failed: {result.get('error', 'Unknown error')}"

        return result["response"].strip()

    except Exception as e:
        return f"AI response failed: {e}"
Because Ollama is running locally, the chart data is processed on your own machine instead of being sent to a cloud AI service.
At this stage, the AI Report Generator can understand the Excel chart data and create short insights that are ready to be added into the PowerPoint report.
Step 7: Create the AI Report Generator Output
After generating the AI insights, the next step is to create the final PowerPoint report.
The AI Report Generator takes each selected Excel chart, exports it as an image, places it into a PowerPoint slide, and adds the AI-generated insight below the chart.
The main workflow looks like this:
export_chart_as_image(chart_object, image_path)

ai_insight = get_ai_insight(
    chart_title=chart_title,
    chart_data=chart_data,
    model_name=model_name,
    user_instruction=user_instruction,
    report_style=report_style
)

slide = presentation.Slides.Add(slide_number, 12)

slide.Shapes.AddPicture(
    FileName=str(image_path),
    LinkToFile=False,
    SaveWithDocument=True,
    Left=150,
    Top=90,
    Width=620,
    Height=340
)
This part exports the Excel chart, creates a new PowerPoint slide, and adds the chart image to the slide.
Then the app adds the chart title and the AI-generated insight:
add_textbox(
    slide,
    chart_title,
    left=80,
    top=30,
    width=800,
    height=50,
    font_size=28,
    bold=True
)

add_textbox(
    slide,
    "Key Insight: " + ai_insight,
    left=130,
    top=460,
    width=700,
    height=90,
    font_size=18
)
Each slide now contains the original Excel chart and a short AI-generated business insight. This makes the output more useful than simply copying charts manually into PowerPoint.
At the end, the app also creates a final summary slide based on all generated insights:
final_summary = get_final_summary(
    insights=insights,
    model_name=model_name,
    user_instruction=user_instruction,
    report_style=report_style
)

create_final_summary_slide(presentation, final_summary)
Finally, the PowerPoint report is saved:
presentation.SaveAs(str(output_path))
At this stage, the AI Report Generator has created a complete PowerPoint report from Excel charts, including slide titles, chart visuals, AI-generated insights, and a final summary slide.
Step 8: Download and Review the Report
The final step is to download and review the generated PowerPoint report.
After the AI Report Generator finishes creating the slides, the app provides a download button so you can save the PowerPoint file to your computer.
with open(st.session_state["output_path"], "rb") as f:
    st.download_button(
        label="Download PowerPoint",
        data=f,
        file_name="AI_Excel_Chart_Report.pptx",
        mime="application/vnd.openxmlformats-officedocument.presentationml.presentation"
    )
Once downloaded, open the PowerPoint file and review the slides carefully. The report should include the selected Excel charts, AI-generated insights, and a final summary slide.
Before sharing the report, it is always good to check:
- Chart titles
- Chart formatting
- AI-generated insights
- Final summary slide
- Any sensitive information
This step is important because the AI can help generate useful insights, but the final report should still be reviewed by the user before it is used in a real business or management presentation.
Limitations and Important Notes
This AI Report Generator is designed to run locally on a Windows machine. It requires Microsoft Excel, PowerPoint, Python, and Ollama to be installed.
The tool exports Excel charts as images before placing them into PowerPoint, so the charts in the final presentation are not editable PowerPoint charts.
Also, while the AI-generated insights can save time, they should always be reviewed before using the report in a real business presentation.
Conclusion
In this post, we built a private AI Report Generator that turns Excel charts into PowerPoint slides using Ollama and local AI.
The main value of this approach is privacy. Instead of uploading business data to a cloud AI tool, the full process runs on your own machine, from reading Excel charts to generating insights and creating the final PowerPoint report.
You can find the full project code on GitHub and modify it based on your own reporting workflow.
This is one practical example of using Ollama for local AI productivity. For another local AI use case, you can also check my post about building a local image renaming app with Gemma 4 and Ollama. If you are interested in using Ollama for private document search, you can also read my RAG with Ollama tutorial.
Frequently Asked Questions
How can AI create PowerPoint reports from Excel?
AI can read the extracted chart data from Excel, understand the trend or key message, and generate short insights that are added to PowerPoint slides automatically.
Can I use AI with Excel and PowerPoint without uploading my data online?
Yes. By using Ollama and local Python automation, the process can run on your own computer without sending Excel data to cloud AI tools.
Is this AI Report Generator private?
Yes. This version is designed to run locally on your Windows machine using Ollama, Excel, and PowerPoint. Your data stays on your computer.
Do I need ChatGPT or an online AI API for this project?
No. This project uses a local Ollama model, so it does not require ChatGPT API or any cloud AI service.
Can this tool automate Excel to PowerPoint reporting?
Yes. The tool scans Excel charts, exports them, adds them to PowerPoint slides, and includes AI-generated insights.
Can I run this AI Report Generator without internet?
You need internet to download Ollama and the AI model first. After setup, the tool can run locally without internet.
Can I use another AI model with Ollama?
Yes. You can use any Ollama model installed on your computer, but the speed and quality will depend on the model size and your hardware.